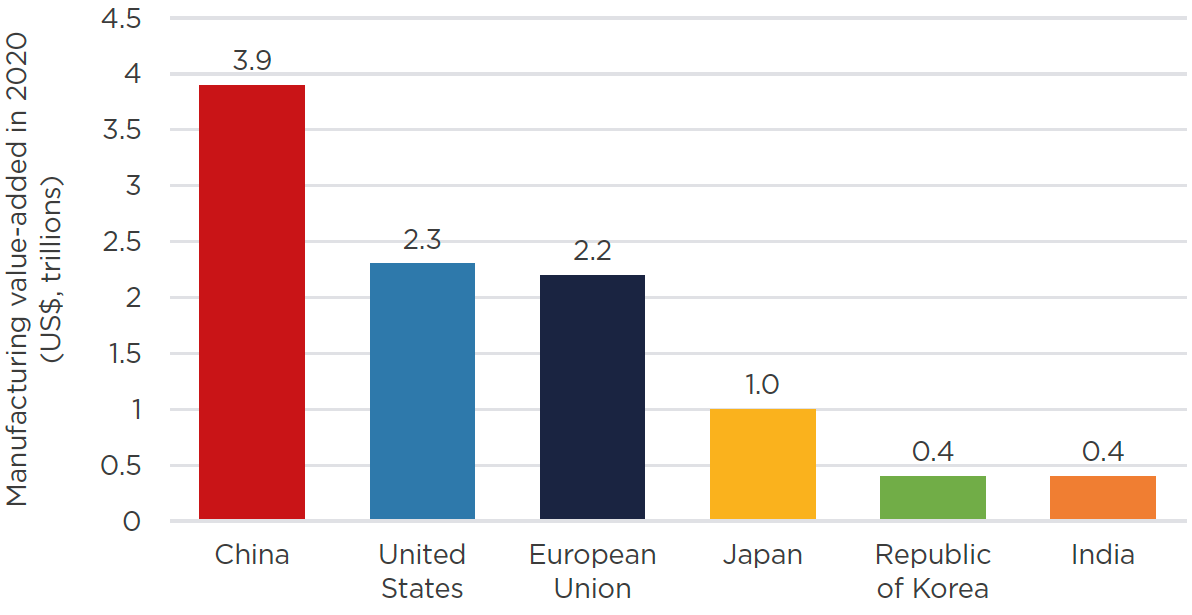
China is one of the world’s manufacturing powerhouses. It produces more than half the world’s steel, aluminum and cement, and is the world’s largest producer of plastics and ammonia. China generates around 30% of manufacturing value added globally, as compared with roughly 16–17% each from the United States and European Union. 1
Manufacturing is the largest source of heat-trapping emissions in China. In 2019, roughly 35% of China’s heat-trapping emissions came from manufacturing. When indirect emissions from electricity generated for manufacturing are included, the figure is 60%. The steel and cement sectors are the largest sources. Chemicals, refineries and smelters of non-ferrous metals, such as aluminum, are also significant contributors. 2
China’s major climate policy statements over the past fifteen years have often included some treatment of the manufacturing sector’s carbon footprint. Mitigation work has historically centered on boosting energy efficiency and reining in overcapacity—priorities that align well with national industrial policies and energy security goals. These priorities remain central to China’s plans to achieve a manufacturing emissions peak and drive broader industrial upgrading to support “high-quality development”. Research, development and demonstration projects are focused on technological breakthroughs for deep decarbonization as a long-term priority.
Note on Terminology
The terms “manufacturing” and “industry” have overlapping definitions in Chinese policy. In official Chinese statistics, “manufacturing” refers to light and heavy industry, including large emissions sources such as cement, steel, non-ferrous metals smelting and chemicals, as well as many sectors with more modest greenhouse gas footprints such as textiles, papermaking and equipment manufacturing. 3 “Industry” is a broader term that includes manufacturing as well as coal mining, oil and gas extraction, and the production and supply of electric power. These two terms are used in this way in this chapter. (In many Chinese policy documents, the term “industry” refers mostly or exclusively to the manufacturing sector, even though the definition in official statistical documents is broader.)
Scope 1 emissions are the emissions a company or facility produces from assets directly under its control, through combustion of fossil fuels for process heat, for instance, or through industrial processes that generate greenhouse gases as a byproduct.
Scope 2 emissions are emissions a company or facility produces indirectly from the energy carriers it procures––for example, through its purchase of electricity or heat produced with fossil fuels.
A. Overview of China’s Manufacturing Sector
In 2021, the gross value added from China’s manufacturing sector was RMB 31.7 trillion (roughly $4.5 trillion), accounting for 27.4% of the nation’s GDP. 4 China led the world in manufacturing value added, with 29.8% of the global total. 5
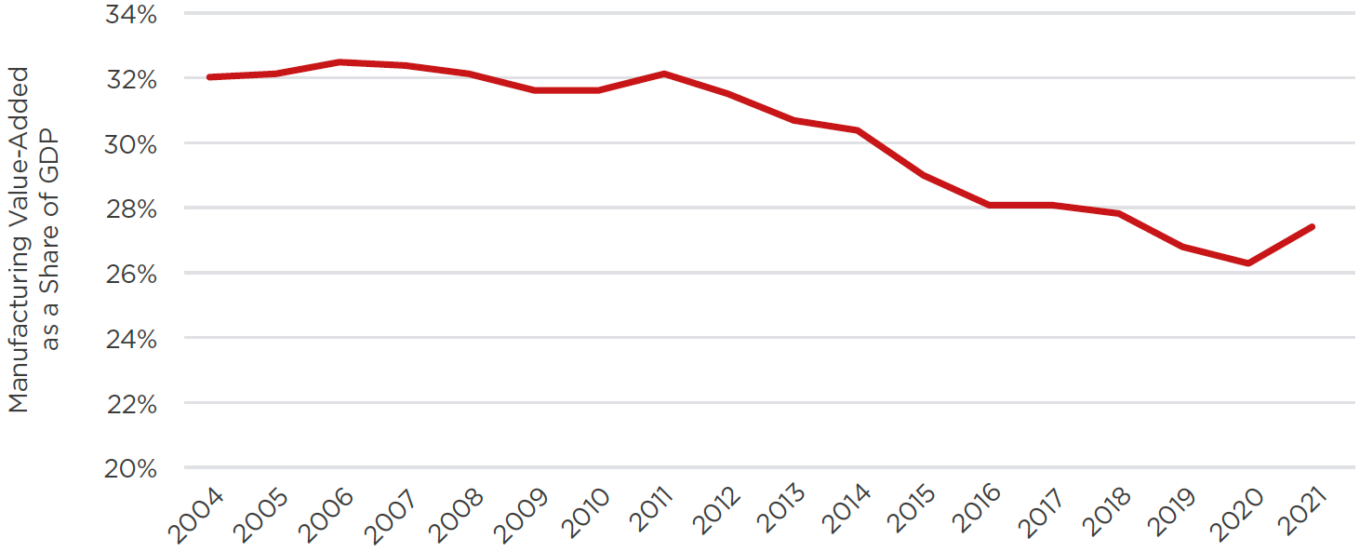
The manufacturing sector accounts for the highest value added share of GDP among any major sectors in Chinese statistical accounting. The next largest are wholesale and retail trade (9.7%), finance (8.0%), construction (7.6%) and housing (6.8%).< 7 This sector has grown 7% on average over the past decade and yet its value added share of GDP has been declining steadily over the past decade, from 32.1% in 2011 to 27.4% today (Figure 11-2). 8
China is the world’s largest manufacturer of a number of important products. It accounts for 50–60% of global output of crude steel, primary aluminum, cement and methanol. 10 It is also the world’s largest producer of other products such as ammonia, plastics, refined copper and textiles, with around 30–40% shares in each. 11 A number of these products involve carbon-intensive or energy-intensive production processes, as discussed further below.
B. Energy Use
Manufacturing is China’s largest energy consumer. In 2020, manufacturing sector activities were responsible for roughly 56% of total energy consumption in China. 12 This share fell fairly steadily during the 2010s after peaking in 2007 at around 62%.
These trends track overall shifts in the structure of the Chinese economy (from manufacturing to services). They also reflect a significant decline in the energy intensity of Chinese manufacturing, which fell threefold between the mid-2000s and the mid-2010s (Figure 11-3).
Energy efficiency gains have been an important driver of these savings. The cement sector, for instance, boosted production volumes by 133% between 2005 and 2014 while increasing coal consumption by only 46%. Between 2000 and 2015, the energy intensity of Chinese steel production fell around 30%. 13 These gains are partly due to turnover in production facilities as inefficient small-scale units have been replaced by larger, more advanced facilities. As of 2020, for instance, the average ages of major energy-consuming assets in China’s steel, cement and chemicals sectors are around 7 to 15 years old, as against 40-year expected lifetimes. 14 But the increasing penetration of such efficient units has also meant less room for new gains, leading to a slower pace of improvements in recent years.
Figure 11-3: Energy Use in Chinese Manufacturing, 2004-19
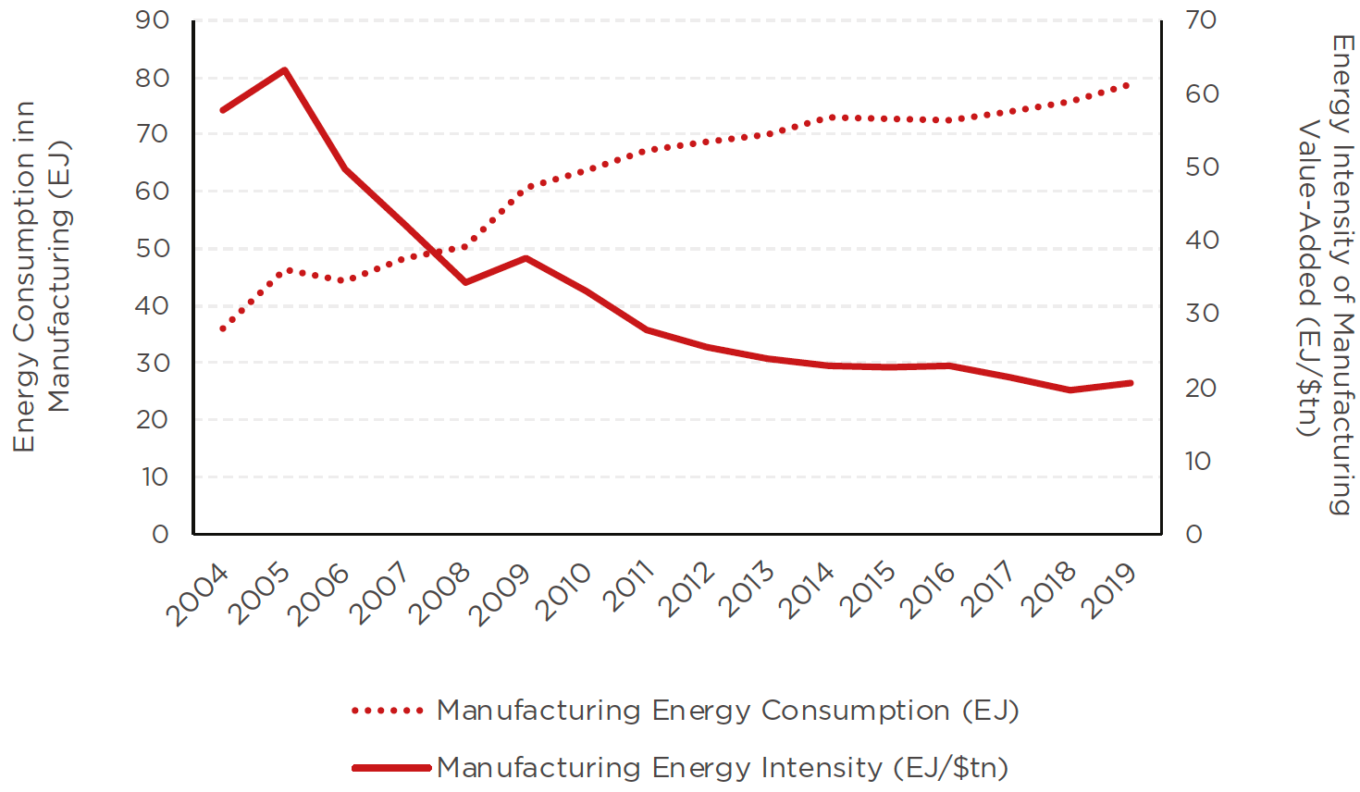
Source: World Bank, National Bureau of Statistics. 15
Within manufacturing, several sectors stand out as particularly energy-intensive. Top of this list is the smelting and pressing of ferrous metals––iron, steel and other iron-based alloys, which accounted for around 13% of national energy consumption in 2019. Other top energy-intensive manufacturing activities include manufacturing of raw chemical materials and chemical products; manufacturing of non-metallic mineral products (e.g. cement, glass and limestone); processing of petroleum, coal and other fuels; and smelting and pressing of non-ferrous metals (e.g. aluminum, copper and zinc) (Figure 11-4). 16 These five sectors combined comprise over 40% of Chinese energy consumption.
Figure 11-4: Energy-Intensive and Carbon-Intensive Industries in China (2019)
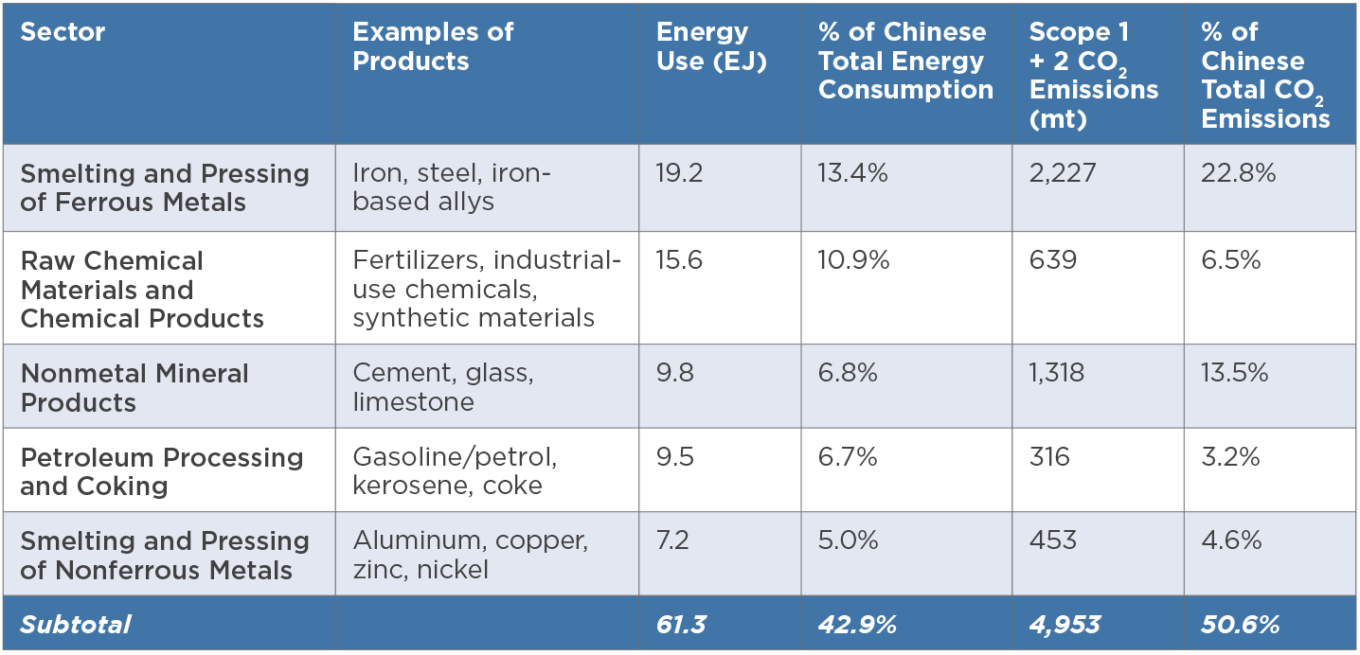
Source: National Bureau of Statistics; Guan et al. (2021); Shan et al. (2020); Shan et al. (2018). 17
C. Emissions of Heat-Trapping Gases
China’s manufacturing heat-trapping gas emissions are relatively varied in their sources and the forms they take. They include:
- Scope 1 emissions of CO2 from fuel combustion for heat (for instance, emissions from the combustion of fossil fuels to create heat for producing ammonia).
- Scope 1 emissions of CO2, nitrous oxide (N2O) and fluorinated gases (F-gases). Some industrial processes – such as cement production – involve chemical or physical transformations that emit heat-trapping gases as byproducts.
- Scope 2 emissions of CO2 from electricity consumption (for instance, emissions from fossil fuel combustion to generate electricity that powers the grinding of raw materials in cement production).
The diversity of sources and types of manufacturing emissions make a comprehensive sectoral inventory challenging. Data from China’s most recent national greenhouse gas inventory, for 2014, indicated that Chinese Scope 1 emissions from energy usage in manufacturing and construction and from industrial processes were a combined 5.2 Gt CO2e, just under half (46.6%) of total national emissions. Around 4.8 Gt CO2e (42.5%) came from CO2, with the balance split between N2O and F-gases. 18
These estimates, notably, do not reflect the Chinese manufacturing sector’s Scope 2 emissions––and the manufacturing sector’s sizable share of national electricity consumption means that these are also important to consider. Tsinghua University’s Carbon Emissions Accounts and Datasets (CEADs) project includes sectoral emissions estimates covering the largest manufacturing sources––CO2 emissions from fossil fuel and electricity consumption and from cement production processes. 19 Per their data, Scope 2 emissions have consistently accounted for around 40% of the manufacturing sector’s emissions footprint in recent years. They estimate around 6.0 Gt of combined Scope 1 and 2 CO2 emissions from the manufacturing sector in 2019, comprising 61.6% of national emissions.
Around half of national emissions came from the same five sectors that dominate manufacturing energy use (Figure 11-4). More than a third came from sectors: non-metallic mineral products (largely cement) and smelting and pressing of ferrous metals (iron and steel). High emissions in these sectors reflect process emissions from cement production as well as the carbon intensity of China’s steel industry, which relies largely upon blast furnaces consuming large volumes of coking coal. 20 (Carbon intensity is the carbon emissions per unit of output.)
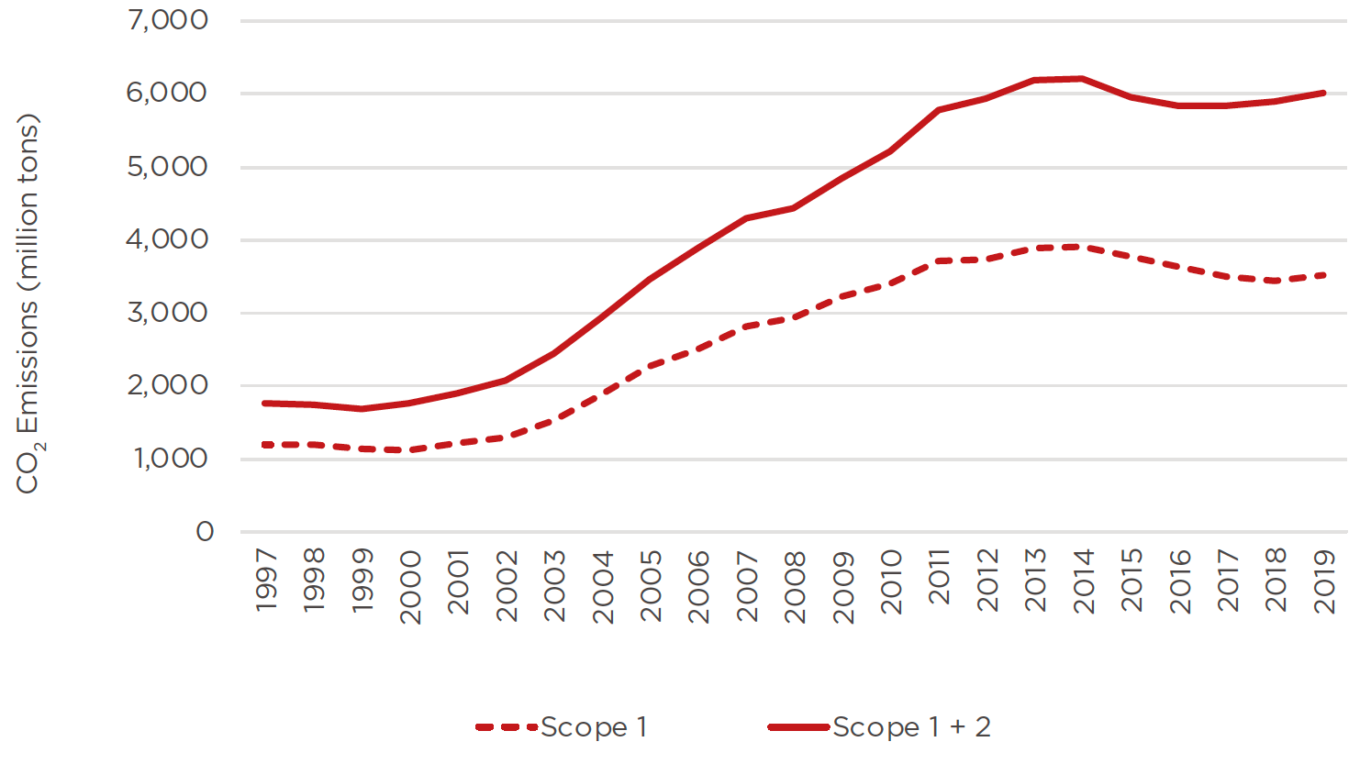
Manufacturing emissions have grown substantially over the past three decades––a threefold increase since the late 1990s, per CEADs data. Yet that increase took place entirely between the early 2000s and the early 2010s (Figure 11-5). Between 2014 and 2017, manufacturing emissions declined around 5%. In 2018, manufacturing emissions started a modest rebound. These trends follow output patterns in major carbon-intensive industrial products such as cement and steel. Production of both items fell amidst slowing economic growth in the mid-2010s, but steel rebounded in the late 2010s amidst renewed infrastructure spending. 21
Figure 11-5: Chinese CO2 Emissions from Major Industrial Sources (1997-2019)
Source: Guan et al. (2021); Shan et al. (2020); Shan et al. (2018) 22
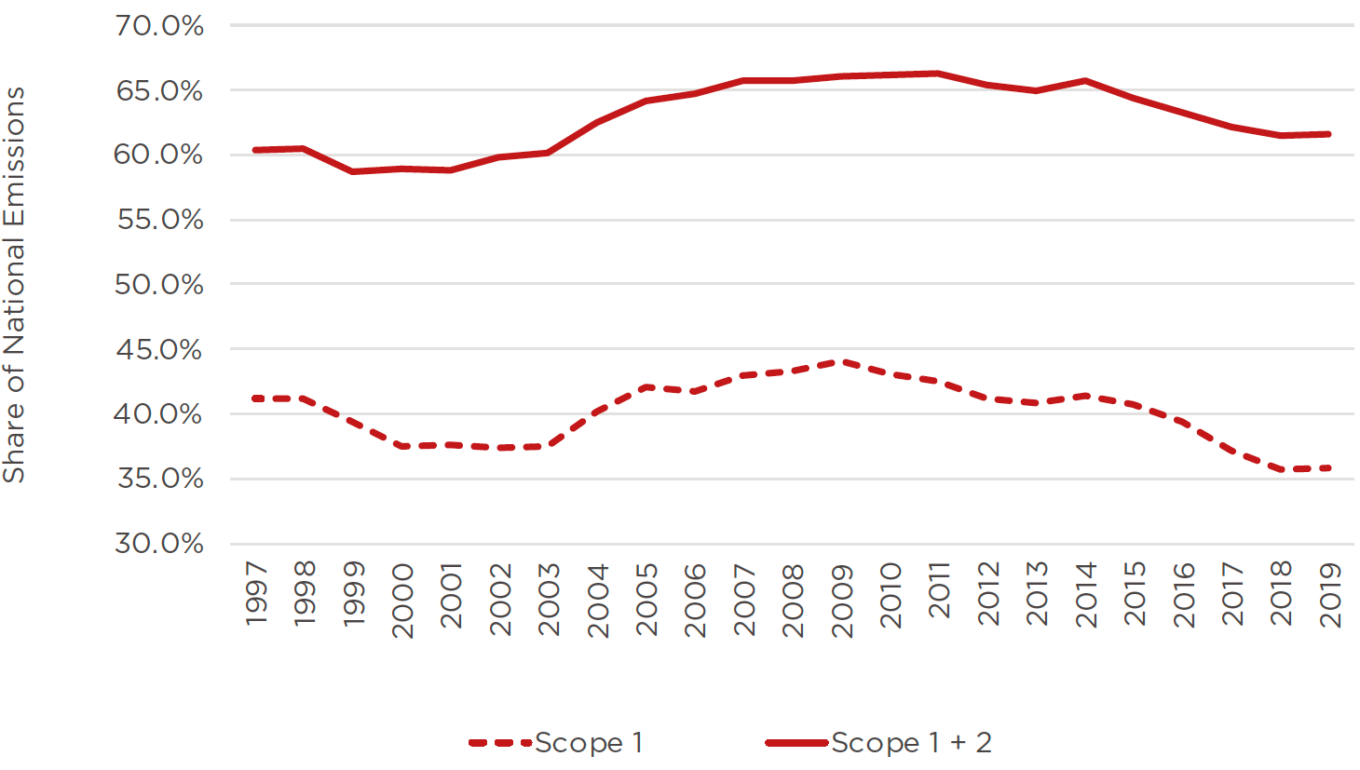
Manufacturing emissions’ share of national emissions likewise grew from the early 2000s but flattened out from the late 2000s and began declining around the early 2010s (Figure 11-6). This trend reflects energy efficiency gains as well as structural shifts in the Chinese economy towards consumption-driven sectors such as services and household use. 23 Service-sector emissions (Scope 1 and Scope 2) in 2019 were just 16.3% of national emissions, a quarter of the manufacturing sector. But service-sector emissions growth has exceeded the manufacturing sector every year from 2010 to 2019, the most recent year in the CEADs inventory.
Figure 11-6: Chinese CO2 Emissions from Major Industrial Sources as a Share of National Emissions (1997-2019)
Source: Guan et al. (2021); Shan et al. (2020); Shan et al. (2018) 24
Economic policy in the COVID era has driven some of China’s largest emissions swings in the past decade. Analysis from the Center for Research on Clean Air and Energy finds year-on-year drops in quarterly national emissions up to 5% during early 2020 and 2022. Between these declines, however, was a surge in emissions, reaching as high as a 15% year-on-year increase in Q1 2021 emissions. These swings largely tracked industrial output. COVID lockdowns in early 2020 and 2022 curtailed manufacturing activity, while tightening policy in the real estate and steel sectors reduced cement and steel production. The 2021 spike, meanwhile, reflected a post-COVID infrastructure stimulus. 25
China has been the world’s largest source of manufacturing emissions for several decades now. Estimates for 2019 by the World Resources Institute suggest that China accounts for 43% of global Scope 1 emissions from industrial processes and from energy usage in manufacturing and construction. Chinese emissions from these sources have exceeded any other country since at least 1990, when their estimates begin. But the gap between China and the rest of the world has grown enormously since then. Chinese emissions exceeded US emissions from these sources by around 10% in 1990; in 2019, they were around six times those of the US and 5.5 times those of India. 26
D. Policy
China’s major policy statements around emissions of greenhouse gases over the past fifteen years have often included some treatment of the manufacturing sector’s carbon footprint. These plans have linked carbon emissions reduction to other policy priorities including energy efficiency, local air pollution and industrial upgrading, with a supporting role for low-carbon technology development and the control of emissions of non-CO2 heat-trapping gases such as N2O and F-gases. 27 These priorities have been captured in a succession of targets for reducing the energy intensity and carbon intensity of industrial value added, issued often in more general plans for the sector. For instance, the Made in China 2025 plan, issued by the State Council in May 2015, targeted a 40% reduction in the carbon intensity of industrial value added by 2025 compared to 2005 levels. 28
Policy documents released in 2021–22 outline China’s updated manufacturing emissions policy priorities since Xi Jinping’s pledge in 2020 to achieve an emissions peak by 2030 and carbon neutrality by 2060. China’s updated Nationally Determined Contribution (NDC), submitted in October 2021, included “a green and low-carbon transformation of the industrial sector” as one of the new measures to implement its 30–60 goals. At a high level, it called for the implementation of peaking plans in high-emitting sectors including iron and steel, non-ferrous metals, petrochemicals and chemicals, and building materials, as well as industrial restructuring targets “guided by the principle of energy conservation and carbon reduction.” More specific themes discussed included overcapacity control, expanded “clean and low-carbon energy” use, and adoption of circular economy and low-carbon technologies. 29
The NDC, as an outward-facing commitment, reflects policy priorities developed through China’s domestic-facing policy apparatus. An important summary of these priorities, at least in the short term, is the Implementation Plan for Carbon Peaking in Industry, released in summer 2022 by the Ministry of Industry and Information Technology (MIIT), the National Development and Reform Commission (NDRC), and the Ministry of Ecology and Environment (MEE). 30 This plan, which covers the manufacturing sector, is one of a series of emissions peaking action plans already released or under development for different sectors and regions. 31 As with many Chinese policy plans, it covers a sprawling range of topics. Key priorities and targets include:
- Priorities: the Plan indicates that energy efficiency and industrial upgrading remain the key focus areas for peaking, with technological innovation more important for post-peaking emissions reductions.
- Priority areas for industrial upgrading include controlling capacity additions and eliminating inefficient excess capacity growth (“resolutely restricting the blind development of energy-intensive, emissions-intensive, low-quality projects”). These are long-standing priorities in heavy industry but have been challenging. Installed steel capacity as of 2019–20, for instance, exceeded policy targets by roughly 20% (200mt). 32
- Other action items include (i) promoting electrification, (ii) aligning industrial siting with the needs of low-carbon production, and (iii) advancing research, deployment and demonstration projects on low-carbon technologies. 33
Targets:
- Peaking emissions in the industrial sector by 2030.
- Reducing the energy intensity of industrial value added by 13.5%, equal to the national goal for reducing energy intensity of GDP.
- Securing a decline in carbon emissions intensity of industrial value beyond the national decline in emissions intensity, targeted at 18% for the same period. 34
The Chinese government uses Five-Year Plans (FYPs) to indicate economic priorities at national, regional and sectoral levels. The current planning cycle (2021–25) features several plans relevant to industrial emissions.
The 14th Five-Year Plan Outline, covering 2021–25, is China’s most important economic policy document, presenting the country’s overall priorities and targets for the period. It is drafted by the State Council, China’s top administrative authority, under guidance from top leadership in the CCP Central Committee. 35 It specifies broad priorities for the manufacturing sector, emphasizing industrial upgrading in service of the long-standing national goal of becoming a “strong manufacturing nation”. 36 Measures towards this end include controlling inefficient excess production and strengthening energy efficiency and other environmental performance indicators in coal use. 37 It also calls out hydrogen, a key input for industrial decarbonization, as one of seven “areas for cutting-edge technological and industrial transformations.” The other areas listed––including artificial intelligence and deep-sea and space exploration––underscore hydrogen’s standing in national innovation agendas. 38
Sectoral or issue-specific FYPs provide targets and more detailed priorities for the manufacturing sector. The 14th Five-Year Plan for Raw Materials, released by the Ministry of Industry and Information Technology, the Ministry of Science and Technology, and the Ministry of Natural Resources, specifically covers iron and steel, building materials, petrochemicals and chemicals, and non-ferrous metals––the most carbon-intensive sectors in manufacturing. 39 Another relevant plan is the MIIT’s 14th Five-Year Plan for Green Development in Industry. 40 Both were released in late 2021.
- Priorities: many of the relevant issues discussed in other plans reviewed above––industrial upgrading, overcapacity, energy efficiency, technology development––are discussed in greater detail in these plans.
- On industrial clustering, for instance, the Raw Materials plan discusses “advancing” a range of specific aims: shifting aluminum facilities to locations with plentiful hydropower or wind resources, siting electric arc furnaces near cities to access scrap steel, and better integrating chemicals manufacturing with green hydrogen production. 41
- On low-carbon manufacturing technology, the plans call out a wide range of technologies for R&D, pilot projects or further promotion. These include pre-commercial hydrogen applications in steel and cement and carbon capture and utilization in cement and chemicals, as well as mature technologies such as waste-derived fuel in cement kilns. 42
Targets: major targets include:
- Declines in energy intensity of 2% in cement and 3.7% in steel by 2025. (The plan reports a 4.7% decline in steel energy intensity among large and medium-sized firms in 2016–20.) 43
- A 5% decline in carbon emissions from electrolytic aluminum by 2025, the biggest energy-consuming sector within non-ferrous metals. 44
- An increase in recycled steel usage in iron supply from 260mt in 2020 to 320mt by 2025, as well as an increase in recycled metals in non-ferrous metals supply from 14.3mt to 20mt (Green Development plan); a 30% share for recycled steel supply in total steel output and a 35% share for recycled copper, up from 25% and 32.5% today (Raw Materials plan). 45 (The absolute volume targets were initially announced by the NDRC’s 14th Five-Year Plan on Circular Economy Development in summer 2021. 46)
The 14th FYP Outline supports industries “with the right conditions” to pursue emissions peaking earlier than the pre-2030 national target. 47 As of mid-2022, official government plans for the high-emitting industrial sectors discussed in this paper did not include any such early-peaking targets, though no specific peaking plans have been released beyond the industry action plan cited above. 48 That said, the absence of stricter targets does not preclude early peaking, especially in sectors such as cement and steel with slowing output growth. 49 Indeed, some industrial associations tied to these sectors have suggested earlier targets. The building materials association in early 2021 announced a goal of sector-wide peaking by 2025 and cement peaking by 2023, while the association for the coking coal industry––a carbon-intensive input for the production of steel and other industrial products––has announced a 2025 peaking target. 50 Companies have been generally more hesitant to issue targets, though the steel sector’s largest three state-owned enterprises, with capacity equal to 21% of 2022 production, have announced peaking targets for 2022–25. 51
Emissions control in these sectors can also benefit from other trends that reduce the carbon intensity of output. For instance:
- Steel: capacity restriction policies in steel seek to incentivize installations of electric arc furnaces (EAFs) and other plant types that help reduce air pollution and carbon emissions footprints. Data from the Center for Research on Clean Air and Energy finds that the share of EAFs in capacity additions grew from 12.9% in 2019 to 38.9% in 2021. 52 The Guiding Opinions on the High-Quality Development of the Iron and Steel Industry, released in early 2022 by the MIIT, NDRC and MEE, targets by 2025 a 15%+ production share in crude steel for EAFs. (EAFs produced 10.6% of national output in 2021 53)
- Aluminum: the Implementation Plan for Coordinating Increases in Efficiency to Reduce Pollution and Carbon Emissions, released by the MEE, NDRC, MIIT and four other ministries, targets a 30% share in 2025 for renewables in power usage by electrolytic aluminum smelters. These smelters account for 6% of national power consumption. The 2021 renewables share in their power mix was 22%, up from just 12% in 2018. These gains largely reflected the relocation of smelters in northern China with captive coal power plants to parts of southwest China with plentiful hydropower. 54
- The NDRC has also introduced pricing surcharges for less efficient smelters. 55 (China’s aluminum smelters are already more efficient than global averages, and even smelters with 4% higher efficiency above the world average will be penalized under this policy. 56) These measures are part of a series of mechanisms in power pricing reforms since 2021 that expose coal-intensive industries to higher electricity prices. 57
On the other hand, ministries have cautioned against overly aggressive application of carbon and energy efficiency targets. The NDRC, MIIT, MEE and two other agencies in October 2021 released Certain Opinions on Rigorously Enforcing Energy Efficiency Restrictions and Advancing Energy Conservation and Carbon Reduction in Major Industries clarifying the import of the 30–60 goals for industrial energy efficiency work. This directive included a warning against economic and social disruptions from “one-size-fits-all” management and “campaign-style carbon reduction.” 58
Carbon neutrality in manufacturing will require the introduction of technologies with limited deployment today, including hydrogen-based iron reduction in steel manufacturing, carbon capture in the cement industry, and CO2 capture and utilization in methanol production. Chinese firms have announced or completed a range of demonstration projects in these areas. 59 But policymakers have publicly recognized the challenges in reaching carbon neutrality in manufacturing. The 14th FYP on Raw Materials speaks frankly on “hard tasks of carbon peaking and neutrality” among factors that make “green and safe development increasingly urgent.” Its treatment of bottlenecks and weaknesses in these sectors cites deficits in technological and resource self-sufficiency (among other concerns) and notes that, “for green and low-carbon development, the task is heavy and the road is long.” 60 Progress globally on this road requires progress in China.
References