Background
China leads the world in deployment of solar power, with more than one-third of global capacity. China has led the world in solar power deployment every year since 2015. 46
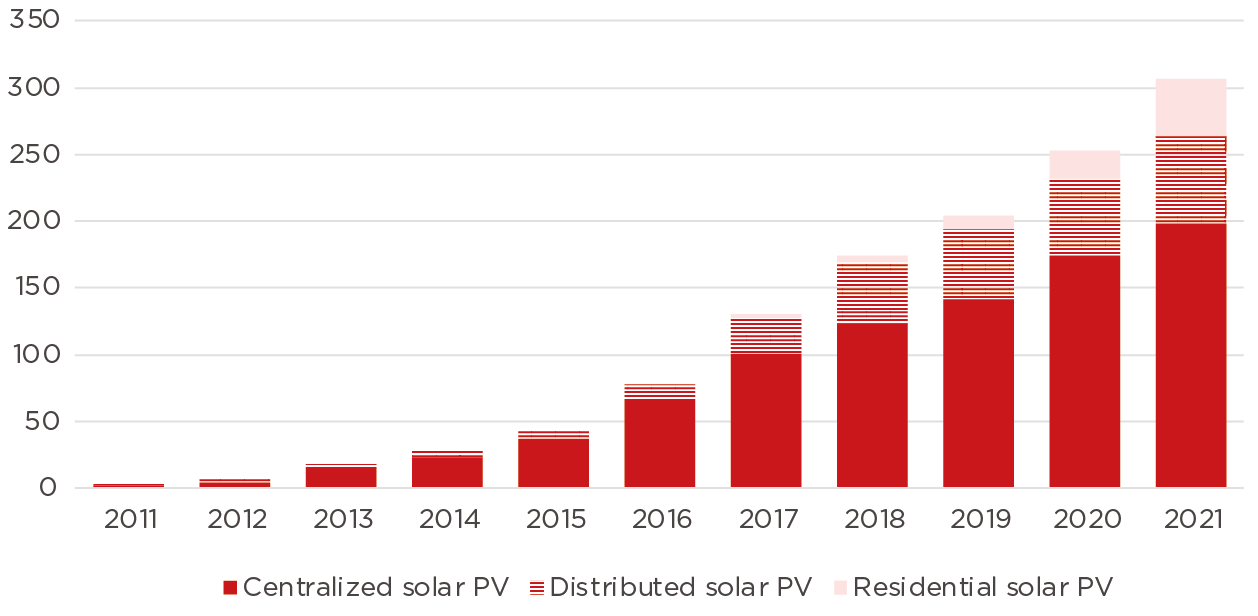
In 2021, 53 GW of solar power capacity was added in China—40% of the global total. 47 At year end, total solar power capacity reached 307 GW. 48
In the first half of 2022, roughly 31 GW of solar power were added to the grid in China. 49
China also leads the world in solar manufacturing, as it has for many years. In 2020, 67% of solar PV modules globally were made in China. 51 China accounts for a similarly large share of global PV cell and polysilicon production. 52
In 2021, solar power was 13% of China’s power capacity and produced roughly 4% of China’s electricity. 53
In December 2018, a 500 MW solar project in Qinghai became the first in China to sell electricity for less than the benchmark price for electricity from coal. 54 As a result of the dramatic scale-up in manufacturing, solar PV in China now costs less than coal-fired power at the wholesale level in most Chinese provinces, and less than retail tariffs for distributed solar in most major Chinese cities. 55
Curtailment is a challenge for the Chinese solar power industry, although the situation has improved in the past few years. In 2020, solar power curtailment was roughly 2% nationally, unchanged from the prior year, with rates of 25.4% in Tibet, 8.0% in Qinghai, 4.6% in Xinjiang and 3.6% in Inner Mongolia. 56
While China initially focused on utility-scale solar PV in remote regions, distributed solar PV has become a growing trend. (State Grid defines distributed solar as systems near consumers, mainly for self-consumption, that connect to transmission and distribution systems at 35 kV or below. 57 Hence, distributed systems may be either ground-mounted multi-MW systems or smaller rooftop systems.) In 2021, over half of new PV installations were classified as distributed, of which 21 GW were residential rooftop solar installations eligible for fiscal subsidies. Hebei, Shandong and Hunan provinces accounted for over half of such installations, many of which focus on rural villages. 58
Photovoltaic (PV) technologies dominate China’s solar industry, with roughly 99% of China’s solar power capacity. Chinese PV manufacturing accounts for the vast majority of global PV production. In 2020, China accounted for 76% of global polysilicon production, 96% of PV wafer production, 78% of PV cell production and 70% of global PV panel production. 59 China exported 100 GW of PV modules in 2021 60 and total Chinese module capacity could reach 500 GW in 2022, far higher than annual PV installations globally. 61
China is also promoting other solar technologies. In 2020, China added 200 MW of concentrating solar power—the only country worldwide to add new CSP capacity—building upon its year-end 2019 capacity of 400 MW. 62 With less than 1 GW of CSP installed, China fell short of a target set in the 13th Five-Year Plan for CSP capacity of 5 GW by 2020. 63 However, several projects are in various stages of the development pipeline and the field remains a policy priority. 64
China has excellent solar resources, especially in the western part of the country.
Figure 6-5: Cumulative Solar PV Installed Capacity by Province (GW) (Year-End 2021)
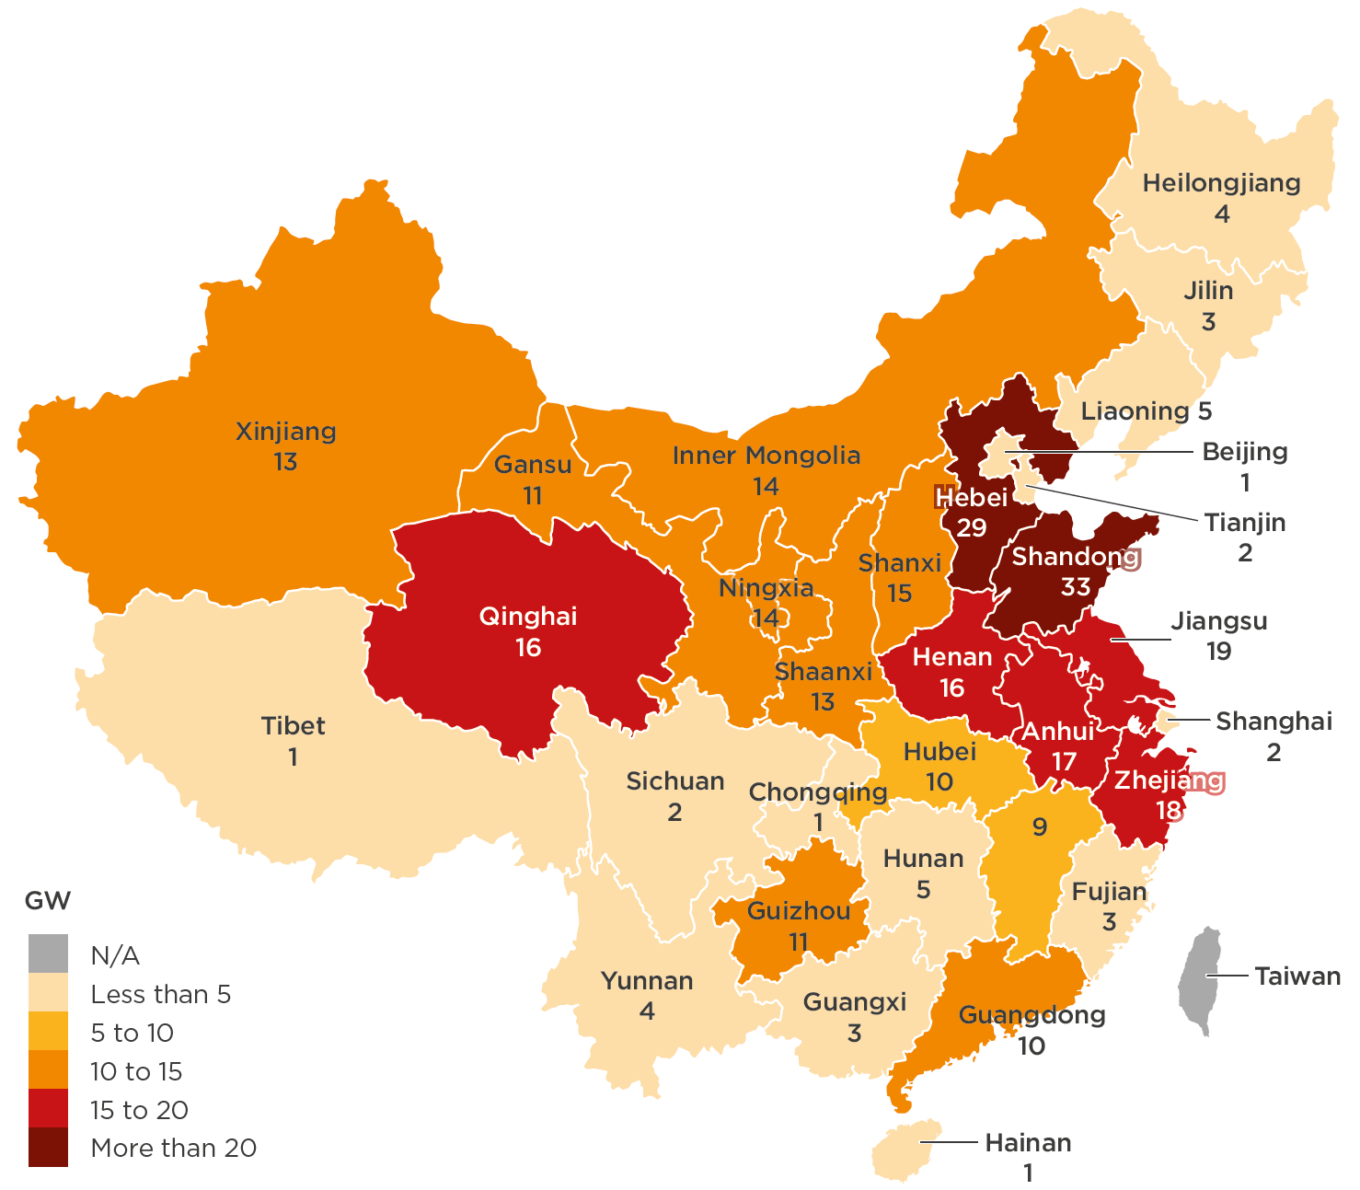
Source: GIZ 2022, based on data from NEA 65
While China’s solar resources are best in the northern and western regions, in recent years more solar has been installed in the populous eastern areas of the country. This is reflected in the top five provinces in installed solar capacity: Shandong, Hebei, Jiangsu, Zhejiang and Anhui.
Air pollution may significantly reduce output from solar panels in some parts of China. One study using 2015 data estimated a reduction of 14% versus unpolluted conditions, though air quality has improved significantly since then. 66
Policy
China supported solar power with subsidized grid feed-in tariffs for many years, but these tariffs have been largely phased out. 67 The feed-in tariff phase-out began with a 2018 announcement that reduced the tariffs and directed local governments to shift most solar procurements to competitive auctions. The changes were seen as an effort to control the cost of solar subsidies (over $15 billion in 2017) and address overcapacity in power markets. 68
The 13th Five-Year Plan for Energy Development set a goal of 110 GW of solar capacity in China by 2020, which China far surpassed. 69
China’s 13th Five-Year Plan for Solar Energy Development contained specific goals for solar technology innovation, including commercialized monocrystalline silicon cells with an efficiency of at least 23% and commercialized multi-crystalline silicon cells with an efficiency of at least 20%. The Chinese government spends heavily on research and development for solar power to help meet these and other goals. Much of this funding comes through the Ministry of Science and Technology (MOST). 70
References