China’s national emissions trading system (ETS), launched in 2017, officially came into operation in 2021. The ETS covers the power sector (electricity and heat generation), which emits almost 5 Gt of CO2 annually (roughly 45% of China’s and 15% of global CO2 emissions). 1 It is the world’s largest emissions trading program in terms of CO2 emissions covered. The Chinese government has announced that the ETS will be expanded to include other sectors in the years ahead. 2
The ETS introduced a carbon price in China and has the potential to play an important role in China’s transition to carbon neutrality. To date, however, the ETS has had little if any impact on CO2 emissions. The reasons include a generous supply of allowances, lack of a hard cap on emissions and limited trading liquidity. At present, regulators appear to be more focused on improving data collection and familiarizing regulated entities with details of the system than on reducing emissions. In the years ahead, the ETS could become an important factor in reducing Chinese CO2 emissions, depending on design and implementation decisions. 3
Background
An ETS is a way to put a price on emissions. Under an ETS, companies acquire rights to release a certain amount of a pollutant, known as allowances, which can be traded. At the end of a compliance cycle, usually every year, these companies are required to surrender allowances to match their verified emissions. The companies may sell surplus allowances and buy allowances to cover any shortfall. Companies that fail to surrender sufficient allowances are subject to penalties.
The Chinese government’s interest in emissions trading dates to at least the late 1990s, when the State Environmental Protection Agency (led by Administrator Xie Zhenhua) explored the feasibility of emissions trading for sulfur dioxide. In 2005, the NDRC authorized Chinese companies to participate in the Clean Development Mechanism (CDM), an international emissions trading program for CO2 and other heat-trapping gases run by the UN Framework Convention on Climate Change. China soon became the world’s biggest supplier of CDM credits, with more than half the world’s CDM projects. 4
In 2011, the Chinese government announced plans to develop a domestic CO2 emissions trading market. Over the next several years, pilot programs were launched in eight cities and provinces—Beijing, Shanghai, Chongqing, Shenzhen, Hubei, Tianjin, Guangdong and Fujian. 5 The design of the pilot emissions trading programs—that were intended to inform a national scheme—drew on experiences in California, the European Union and other jurisdictions.
In 2014, the NDRC released its Interim Measures for Managing Carbon Emissions Trading Rights to start the process of developing standards for a national carbon trading market. 6 The launch of the ETS was, however, repeatedly delayed. It was initially planned to be issued within the 12th Five-Year Plan period (2011–2015), 7 but was postponed. In September 2015, President Xi Jinping announced that the Chinese government would launch a national CO2 emissions trading program by the end of 2017. 8
In December 2017, NDRC released its National Carbon Market Development Plan (Power Generation Sector). 9 The document set forth a three-phase plan:
- Phase 1 (“Basic Infrastructure Establishment”): “Build unified national systems for emissions data reporting, registration and allowance trading.”
- Phase 2 (“Simulated Operation”): “Conduct mock trading of allowances in the power generation sector.”
- Phase 3: (“Deepening and perfecting”): “Conduct spot trading of allowances among participants from the power generation sector…Once the carbon market for the power generation sector is successfully established, the market shall gradually expand to cover other sectors, trading products and trading types.”
The challenge of collecting reliable emissions data, a government reshuffle (with the Ministry of Ecology and Environment (MEE) replacing the Ministry of Environmental Protection in an effort to elevate the importance of environmental protection) and other factors led to a delay in the rollout of the ETS. 10
In April 2021, President Xi mentioned the ETS in a high-profile speech at the Leaders Summit on Climate Change, tying it to his carbon peaking and carbon neutrality goals. 11
ETS design and first implementation cycle:
At the end of 2020, the MEE published its allocation plan for the power sector. The first annual implementation cycle started on January 1, 2021, with the MEE publishing the Interim Rules for Carbon Emissions Trading Management that same month. The Rules came into effect in February 2021 12 clarifying the inclusion criteria of key emission entities, how allowances would be set and allocated, verification methods, reporting and information disclosure, supervision and penalties for breach.
The initial compliance cycle included 2225 participating entities from the power sector 13 with compliance obligations covering their 2019 and 2020 emissions. 14, 15
- The emissions allowances—each representing the right to emit one tonne of CO2—were determined based on actual output levels of coal- and gas-fired power plants (total KWh of electricity generated), using CO2 emission intensity benchmarks in tonnes of CO2/KWh for electricity and tonnes of CO2/GJ for heat generation. 16
- The threshold for inclusion in the ETS was set at 26,000 tonnes of CO2 per year per entity. This is roughly equivalent to the annual emissions of a small five-megawatt (MW) coal-fired power plant. 17
- The initial 2225 participants—described as “key emission entities”—were selected based on their greenhouse gas emissions in 2013–2018, as collected, verified and compiled by MEE’s provincial subsidiaries. 18 The vast majority of the entities covered in the first cycle are coal-fired power plants with a small number of gas-fired plants, reflecting the structure of China’s power fleet.
- Although the ETS only covers the power sector, the inclusion of captive power plants in the participating entities impacts other sectors too. Captive power plants are built to provide stable power supplies with lower energy costs for the private use of industrial or commercial sites. Captive power plants account for roughly one-third of the entities regulated by the ETS in its first implementation cycle. 19 Nearly half of these captive plants serve the chemical industry, with others covering pulp and paper as well as metals, among others. Since these captive plants are usually smaller and less efficient (circulating fluidized bed, CFB or subcritical plants) than large and new coal power plants (ultra-supercritical plants), the ETS would therefore lead to a more rapid phase out of these plants. 20
Permit allocation
- Permits were allocated to the different entities based on emissions intensity “benchmarks,” and were allocated for free in the first compliance cycle.
- Coal power plants were divided into three benchmark categories and gas-fired power plants followed one unified benchmark.
- Gas-fired power plants do not have a compliance obligation, so do not need to purchase allowances when they have a deficit. 21 This is an indirect subsidy on gas plants in order to encourage coal-to-gas switching.
- CFB plants received 30% more allowances than large conventional coal plants and 192% more than gas-fired power plants. CFB plants use low-grade coal which makes their emission intensity higher than other coal technologies.
- As the ETS covers only coal- and gas-fired power plants, generation from non-fossil energy sources, such as renewables and nuclear power plants, does not receive any allowances and cannot act as a source of supply to the market. 22
- Entities are also allowed to use Chinese Certified Emissions Reduction (CCER) offset credits to meet compliance obligations for up to 5% of verified emissions. 23
In March 2020, the 2225 regulated power generation sites received their preliminary allocation of emission permits for 2019 and 2020, and opened a trading account in the Shanghai Environment and Energy Exchange. 24
Figure 10-1: Benchmark Design for Electricity Generation for 2019 and 2020
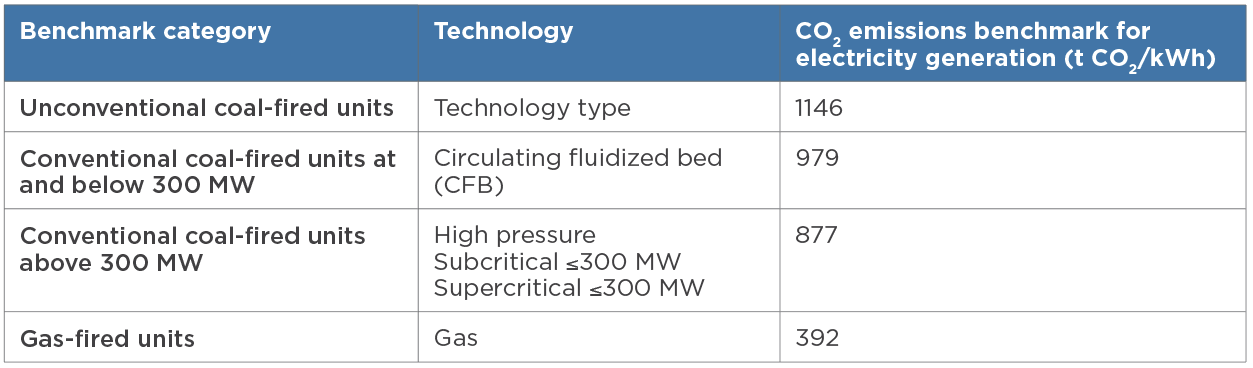
Source: International Energy Agency 25
The initial allowances covered an estimated 4.5 Gt of CO2, 26 making China’s ETS the largest emissions trading system globally.
Yet China’s ETS is currently designed using intensity-based targets, thus limiting its effectiveness for emissions reductions: Compliance obligations are measured in emissions per unit of production (or per unit of electricity generated) so the ETS does not set a cap on total emissions, unlike the EU ETS and California’s Cap-and-Trade Program which hold participating entities accountable for their absolute emissions and set the overall emissions cap several years into the future. The aim of the first compliance cycle was therefore to encourage participation and allow the regulator to collect historical data and test the system.
Moreover, the benchmarks for the first compliance period were higher than the average CO2 emissions factor of the coal fleet. As a result, most of the power plants had sufficient allowances to cover their compliance needs in the first cycle. 27 The ETS effectively incentivizes an improvement to the overall efficiency of coal-fired plants and helps reduce their CO2 emission intensity 28 by penalizing aging and inefficient thermal plants if their emission intensity is above the benchmark. But more efficient thermal plants have surplus allowances through which they can generate revenue (as they can sell this on the allowance market). Gas-fired power plants are also a case in point.
This output-based allocation provides flexibility given that China’s energy demand is still growing and industrial capacity is expanding. This approach is consistent with China’s climate intensity target in the 14th Five-Year Plan (2021–2025). 29
Going forward, more sectors will be added to the ETS (by 2025), the allocation will likely be tightened and an absolute cap could be introduced to replace the intensity target, although the latter is more likely after 2025.
Reporting and verification
- All regulated entities in the initial phase are subject to monitoring, reporting and verification (MRV) of their emissions in 2019 and 2020.
- MRV for emissions in 2020 is also required from sites whose annual emissions are above the 26,000t CO2 threshold in sectors that were named for future inclusion in the ETS (petrochemicals, chemicals, building materials, steel, non-ferrous, pulp and paper, and aviation).
- Between April and June 2021, power generators included in the compliance cycle reported their emissions in 2020 to MEE, which subsequently confirmed the ETS coverage and the list of sites included in the first compliance cycle.
- Between September and December, the additional sectors that were originally nominated for inclusion within the ETS also completed reporting their 2020 emissions to the MEE.
MRV is a critical element of the ETS. In March 2022, the MEE discovered problems with emissions data submitted by power plants, following an inspection campaign that ran through the fourth quarter of 2021. 30
Data and enforcement challenges
- Since emissions are calculated based on the amount of coal burned and quality of the fuel, companies can buy small amounts of high-quality coal and submit this for examination but then use mostly cheaper, low-quality coal. 31
- The provincial MEEs are sent to inspect but some have inadequate personnel and technical ability. They also face a conflict of interest as many of the biggest emitters are state-owned companies that are critical for local growth, development and the security of energy supplies. 32
- For power plants, penalties are not a deterrent as violations are only subject to an administrative penalty of up to 30,000 yuan. This is related to the fact that ETS regulations are ministerial level, thus capping the permissible fine. If and when compliance moves under the purview of the State Council, which ranks above the MEE, ETS implementation will be more robust as penalties will be higher. 33
Trading
- Following the reporting process, participating entities received their allowance for the first compliance period. Provincial environment bureaus allocated allowances to enterprises covered in their jurisdictions.
- Allowances were then issued in the national ETS registry hosted on the China Hubei Carbon Emissions Exchange, which serves as the registry of transactions and holdings until an official national ETS registry is established. The trading platform is based at the Shanghai Environment and Energy Exchange. 34
- Only compliance entities are currently allowed to trade in China’s national ETS and only spot trading is allowed. There are currently no financial derivatives available.
- Transactions are referred to as either listed trades or over-the-counter (OTC) bulk trades (bilateral OTC trades that cleared on exchange at the end of each session). They have a daily price fluctuation limit of 10% and 30%, respectively. 35
- China’s ETS pilots continued operations in parallel but, for the most part, saw trade volumes drop as power sector emitters turned to the national ETS.
- Emitting companies in sectors other than power generation are still regulated by the respective regional markets, though some captive power plants in Beijing and Guangdong have shifted to the national ETS. The pilots’ role will likely decrease as the national ETS develops. 36
- There was also some trading activity in 2021 on the Beijing Green Exchange and China Hubei Carbon Emissions Exchange.
The first compliance cycle
The first compliance cycle was heralded as a success by the MEE given the high compliance rate, estimated at 99.5%. 37> The China Emission Allowance (CEA) traded between RMB 40 and RMB 60 per tonne of CO2 during most sessions and remained near RMB 60 per tonne of CO2 in May 2022. While these prices are just a fraction of the EU ETS price, Chinese policymakers were not prioritizing high prices during the first compliance cycle. Indeed other emissions trading systems, including the European ETS, went through several years of low prices and limited liquidity after initial launch.
Trading volumes of CEAs was very thin—below 100 thousand tonnes in most sessions. Volumes increased in late November 2021 when the end-of-year deadline for surrendering allowances for compliance drew near. Entering 2022, trading activities almost dried up with many sessions seeing only trivial amounts of tonnes changing hands. (A slow start is not uncommon for emissions trading systems. In 2005—its first year—the EU ETS saw 321 million allowances traded. In 2021, the number of allowances traded reached 12 billion.) 38
Figure 10-2: Allowance Trades in China’s carbon market (2021)
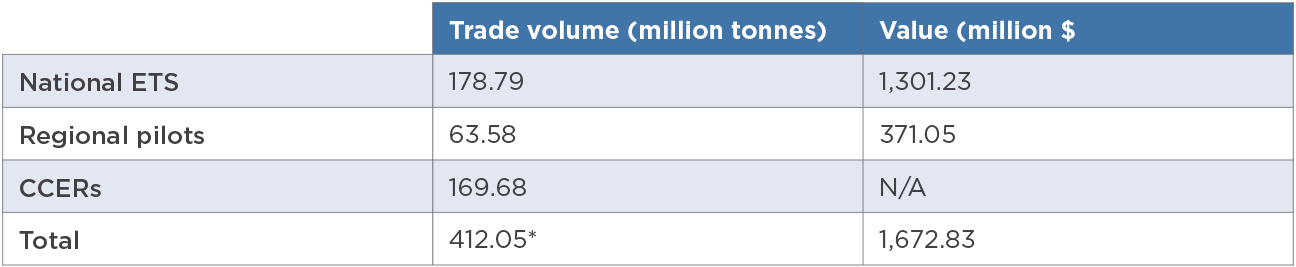
Source: China Dialogue Note: Total volume includes allowances transacted in pilot ETS, national ETS and CCER transactions. Value includes only allowance units (as CCERs are mainly traded over-the-counter, there is no publicly available source for prices). Transactions of local offset units in the separate pilots are small, and not included in this assessment. 39
The first compliance cycle had, at most, a negligible impact on CO2 emissions. That is because:
- Power plants have sufficient allowances to cover their compliance needs. One study estimated final verified emissions for 2020–2021 at 8.68 billion tonnes, against a known total allocation of 9.01 billion allowances. 40
- The use of offsets further loosened the supply-demand balance. Roughly 30 million offsets were used. In combination, the excess allowances plus offsets left a surplus of 360 million allowances going forward into the new compliance period. 41
- The low allowance price also partly reflected the low cost of improving efficiencies in many Chinese coal plants. (Much higher carbon prices would be required to incentivize fuel switching from coal to natural gas or renewables.)
The second compliance cycle and beyond
The ETS’s second compliance period started in 2022 with the covered entities unchanged. The new cycle is expected to cover 2021–2022.
In October 2021, the NDRC issued new guidelines on coal-fired plants’ retrofitting and upgrading, seeking to reduce thermal plants’ average coal consumption to 300 grams standard coal/kWh in 2025, down from the current level of 305 grams standard coal/kWh. 43 This led to a rise in CCER prices, although CCER prices have remained lower than the ETS allowance price, at RMB 20 to RMB 30/tCO2. The CCER offsets therefore offer covered entities a way to lower their compliance costs under the ETS. Allowing offset use also helps achieve other objectives, such as redirecting carbon finance for mitigation actions to sectors not under the ETS. But offsets can be regarded as cheaper substitutes for compliance, reducing the net allowance demand of entities and resulting in an allowance surplus. Going forward, the government will need to make decisions regarding the role of offsets when setting allowance allocation benchmark levels. 44
Climate Impacts
The ETS has improved emissions data collection, built capacity in covered entities and raised awareness of the cost of carbon emissions. To date, however, the ETS has had at most a marginal impact on emissions.
The extent to which the ETS will play a role in meeting China’s carbon peaking and carbon neutrality goals depends on a number of factors, including:
- the levels at which benchmarks are set;
- how rapidly the ETS moves from an intensity-based system to absolute emissions caps;
- the extent to which allowance prices are allowed to rise;
- whether free allocations are replaced with auctions;
- the speed with which other sectors are included;
- when ETS regulations are elevated to State Council level; and
- the capacity of regulated entities and local officials.
Other emissions trading systems around the world took a number of years to move from experimental stages to maturity. The pace at which China’s ETS does so could have a significant impact on global CO2 emissions.
References