In 2021, China’s CO2 emissions were roughly 11.3 Gt—almost one-third of the global total. Roughly 10.5 Gt were from the combustion of fossil fuels (coal, oil and gas). Most of the rest were from cement manufacturing. China’s CO2 emissions exceeded those from the United States, European Union and Japan combined. 2
Figure 1-1: CO2 Emissions from Fossil Fuel (2021)
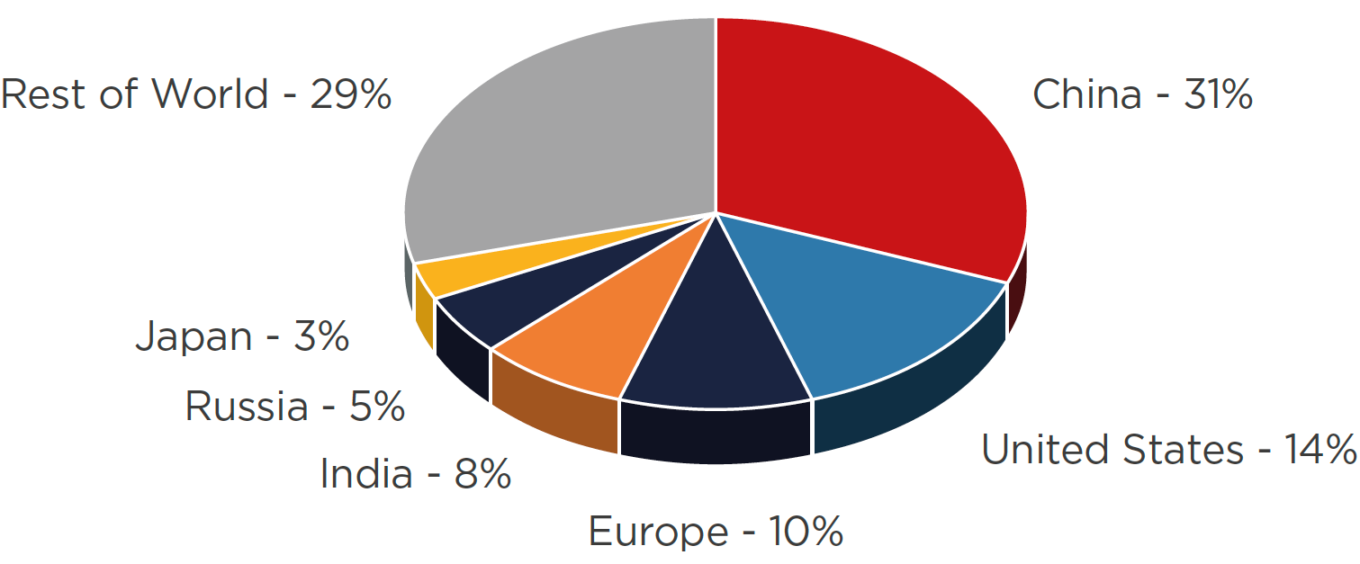
Source: BP Statistical Review of World Energy 2022 3
i. Emissions Metrics
Total annual emissions from a country’s territory are not the only way to measure contributions to global warming. Other common metrics include (a) cumulative emissions over many years, (b) per capita emissions, (c) emissions per unit of GDP (often referred to as “carbon intensity”), and (d) consumption-based emissions.
a. Cumulative CO2 emissions. Once emitted, CO2 remains in the atmosphere for many years. According to the IPCC, more than two-thirds of a pulse of CO2 remains in the atmosphere for several decades, and 15%–40% remains in the atmosphere for more than 1000 years. Cumulative emissions over long periods are an important measure of a country’s contribution to current global warming. 4
One common metric is cumulative emissions since the beginning of the Industrial Revolution in the mid-18th century. Roughly 14% of the CO2 emitted globally between 1751 and 2020 came from China. Roughly 25% came from the United States and roughly 22% from the EU (28). 5
Figure 1-2: Cumulative CO2 Emissions (1751–2021)
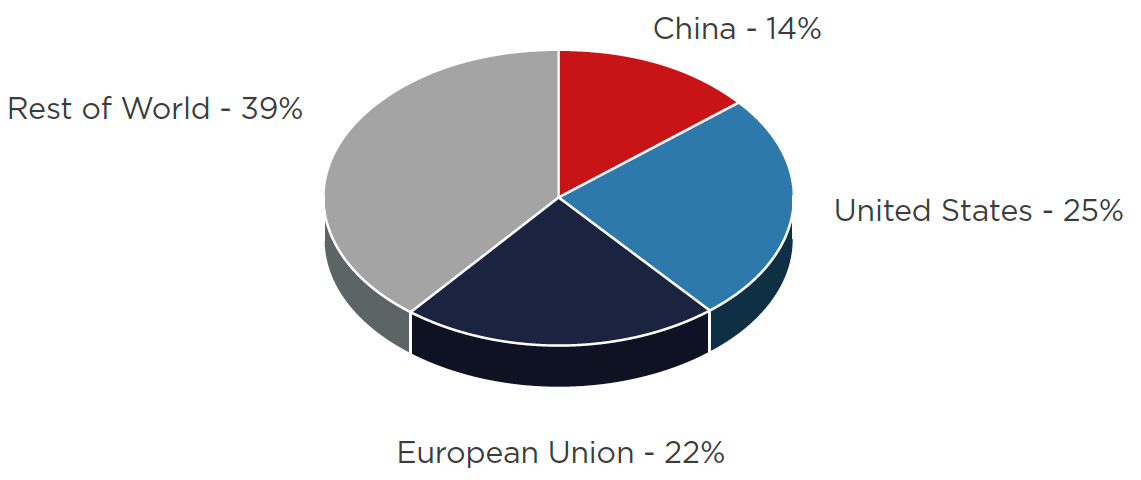
Source: Our World in Data based on CDIAC and Global Carbon Project 6
b. CO2 emissions per capita. In 2021, Chinese CO2 emissions were roughly 7.4 tonnes per person—much less than the United States (14.1 tonnes per person) and less than Japan (8.4 tonnes per person). China emits more CO2 per capita than Europe (5.0 tonnes per person) and much more than India (1.8 tonnes person) and Africa (0.9 tonne per person). 7
Figure 1-3: Per Capita CO2 Emissions from Fossil Fuels (2021)
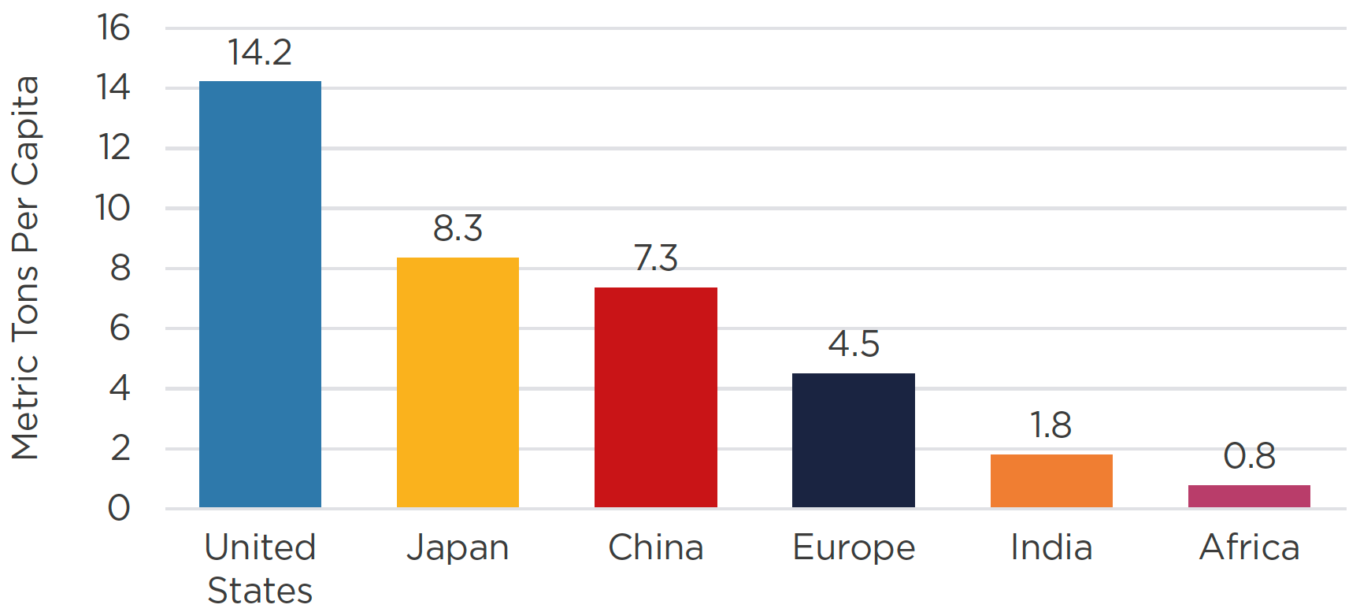
Sources: BP Statistical Review of World Energy (June 2022); UN Department of Economic and Social Affairs – Population) 8
Within China, there are significant regional variations in per capita emissions.
- The highest per capita emissions come from northern provinces, including Inner Mongolia, Ningxia and Shanxi. These provinces have many energy intensive heavy industries and rely heavily on coal for heat and power. Some export electricity to other provinces. 9
- The lowest emissions come from southern and western provinces, including Sichuan and Yunnan. Light industry plays a significant role in the industrial structure, heating demand is modest and hydro provides a large share of the power supply in these provinces. 10
c. CO2 emissions per unit of GDP (carbon intensity). In 2021, China emitted roughly 0.39 kg of CO2 from fossil fuels per dollar of GDP. The carbon intensity of China’s economy has been steadily improving for the past 15 years due to structural shifts in the Chinese economy (from manufacturing to services), policies encouraging the phaseout of inefficient industrial facilities, energy efficiency standards and other factors. However China’s carbon intensity remains high in comparison with other major economies, including the United States (0.20), Japan (0.19) and the European Union (0.13). 11
Figure 1-4: Carbon Intensity (kg CO2 Emissions from Fossil Fuels per $GDP PPP) (2021)
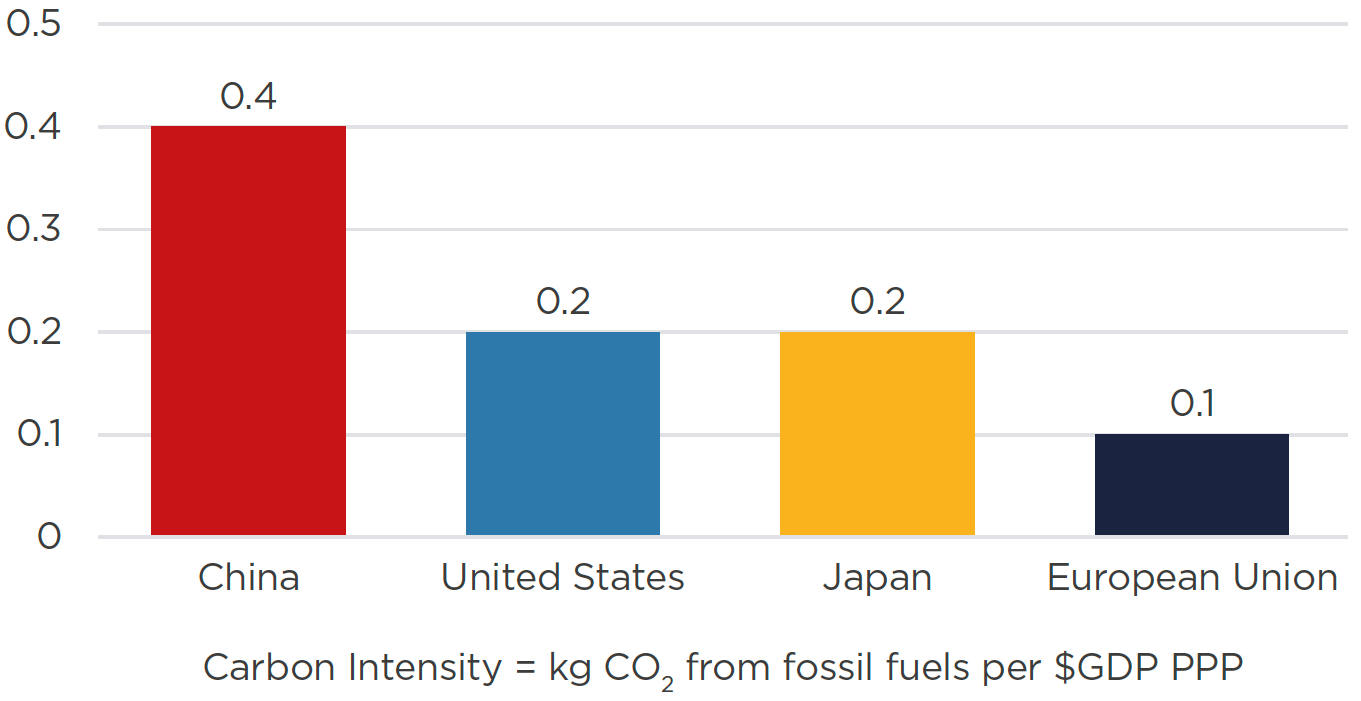
Source: BP Statistical Review of World Energy 2022; IMF Data Mapper-GDP Current Prices 12
d. Consumption-based emissions. Consumption-based emissions accounting allocates emissions from production of a good to the place that good is consumed. Thus, if a good is produced in Country A but consumed in Country B, emissions associated with producing that good are allocated to Country B. This contrasts with traditional territorial or production-based emissions accounting, which assigns all emissions that occur within a country to that country.
China is the world’s leading net exporter of goods. Many of the goods China exports are produced in carbon-intensive processes. As a result, a consumption-based emissions accounting system reduces China’s CO2 emissions as compared to traditional territorial emissions accounting.
In 2019, China’s share of global CO2 emissions using consumption-based emissions accounting was roughly 27%. This is four percentage points less than China’s 31% share of global CO2 emissions using a traditional territorial emissions accounting system. 13
China remains the world’s largest CO2 emitter when using consumption-based accounting, but by a somewhat smaller margin than when using traditional territorial accounting. (Using consumption-based accounting, the world’s second largest CO2 emitter—the United States—was responsible for 16% of global CO2 emissions in 2019, as compared to 14% with traditional territorial accounting.) 14
Figure 1-5: Production- and Consumption-Based CO2 Emissions – China (1990–2019)
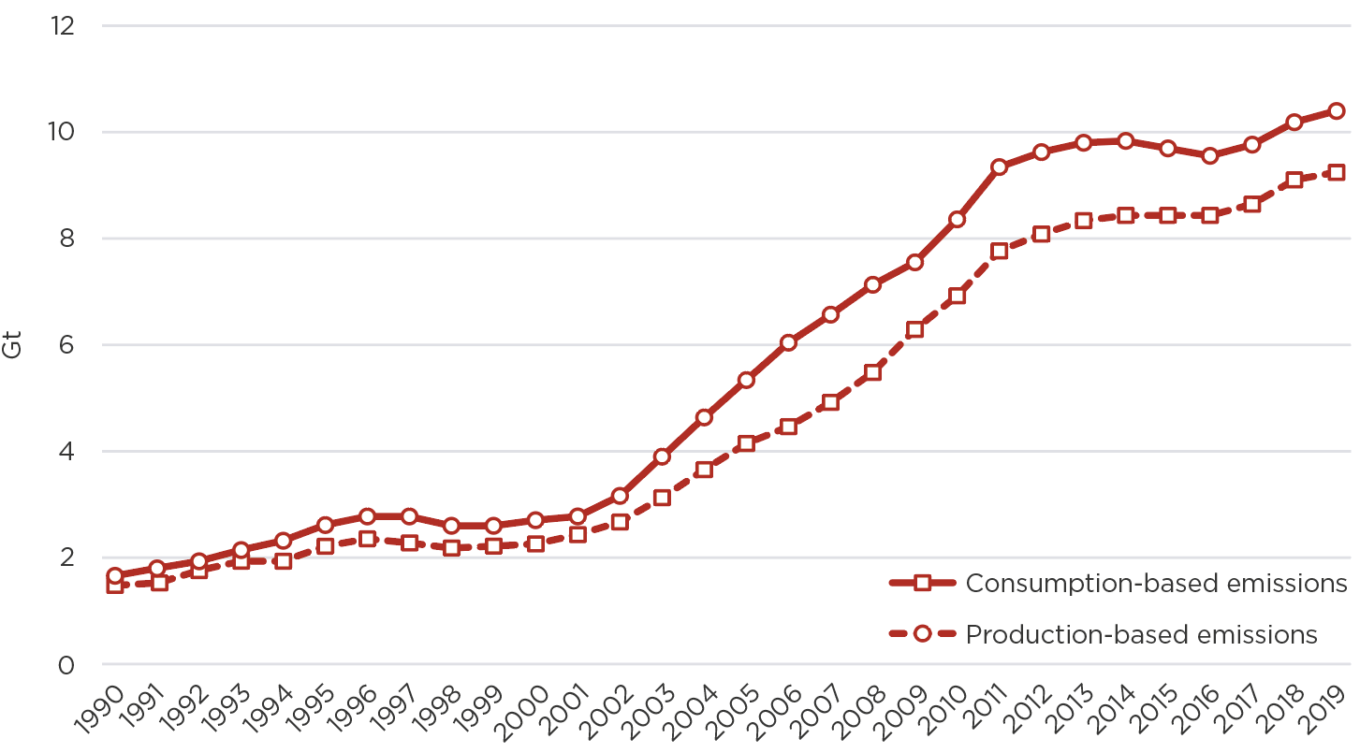
Sources: Our World in Data
ii. Emissions Growth
China’s CO2 emissions have been rising for most of the past 40 years. 15
- In 1980, China’s CO2 emissions were less than 1.5 Gt. Per capita emissions were less than North Korea’s per capita emissions today. 16
- Between 1980 and 2000, China’s CO2 emissions grew at roughly 4% per year, as the Chinese government’s “Reform and Opening Up” policies produced steady economic growth.
- Between 2000 and 2012, China’s CO2 emissions shot up roughly 9.5% per year, reflecting the country’s extraordinary economic growth during this period. Chinese CO2 emissions nearly tripled in 12 years. This period included the largest decadal CO2 emissions growth of any country in history, by far.
- Between 2013 and 2016, China’s CO2 emissions held roughly steady. In several years during this period, according to some estimates, China’s CO2 emissions declined. The plateau in China’s CO2 emissions from 2013 to 2016 was the result of a number of factors, including (i) a structural shift in the economy away from heavy manufacturing, (ii) a cyclical downturn in some energy-intensive industries, (iii) slower overall economic growth, (iv) coal-to-gas switching, (v) increases in solar and wind power, and (vii) greater hydropower generation due to significant rainfall in several years. 17
- From 2017 to 2019, China’s CO2 emissions began climbing again. Estimates vary, but an average of leading estimates suggests that CO2 emissions rose by roughly 2% in 2017, 3% in 2018 and 2.5% in 2019. Causes included a cyclical rebound in some energy-intensive industries and (in 2018) greater demand for heating and cooling due to an unusually large number of hot and cold days. 18
- From January to April 2020, the COVID-19 pandemic led to widespread lockdowns and disruptions of economic activity in China. CO2 emissions fell sharply. One analysis found that CO2 emissions in the weeks around Chinese New Year 2020 were 25% less than CO2 emissions in the weeks around Chinese New Year 2019. 19 Other analyses found that CO2 emissions during the first quarter of 2020 fell in the range of 10–20% year-over-year. 20
-
In the second quarter of 2020, COVID lockdowns were steadily relaxed. During the second half of 2020, CO2 emissions were above pre-pandemic levels, in part because economic recovery measures focused on heavy, carbon-intensive industries. For 2020 as a whole, CO2 emissions increased roughly 1.5%. 21
-
In 2021, CO2 emissions rebounded dramatically, increasing 5–6%. Greater electricity demand, most of which was supplied by coal-fired power plants, was the main reason. 22
-
During the first half of 2022, CO2 emissions in China fell sharply. According to preliminary estimates, Chinese CO2 emissions declined 1.5% year-over-year from January-March 2022 and 8% year-over-year from April-June 2022. COVID lockdowns, the ongoing real estate slump (leading to less cement and steel production) and strong growth in renewables output were among the reasons. 23
Figure 1-6: China’s CO2 Emissions from Fossil Fuels (Gt) (1985–2021)
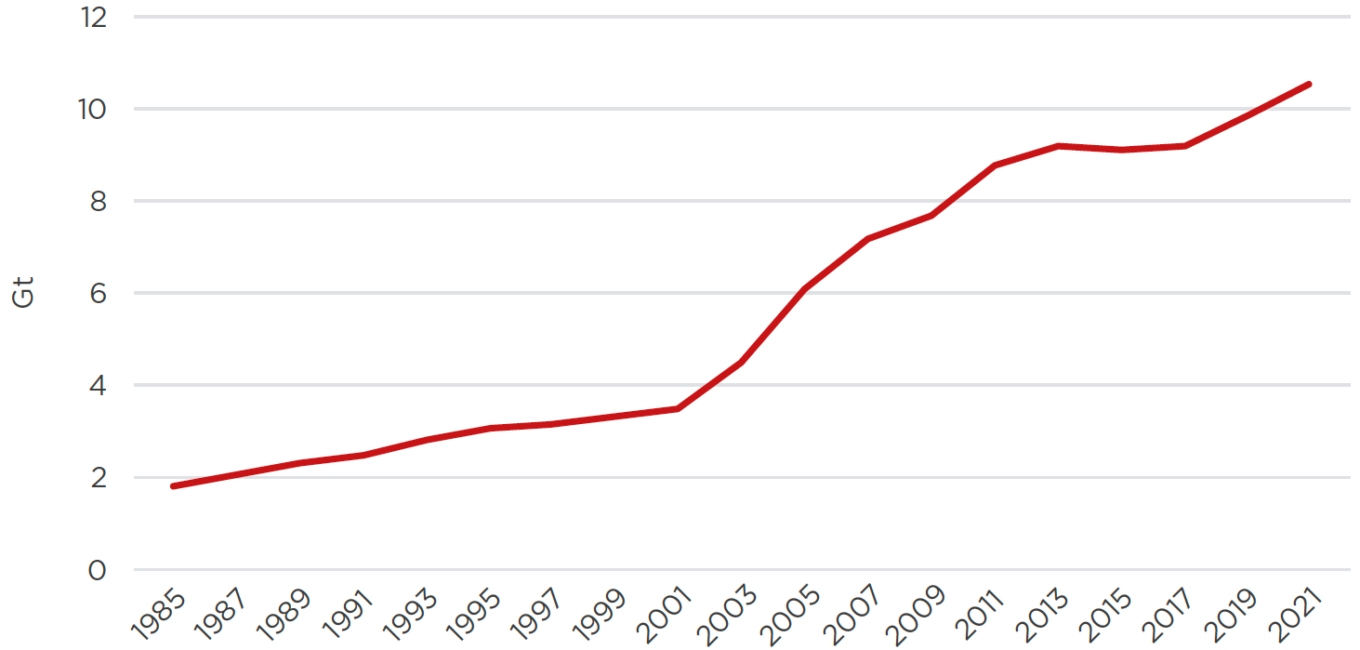
Source: BP Statistical Review of World Energy 2022 24
iii. CO2 Emissions by Sector and Source
Roughly 45% of China’s CO2 emissions come from electricity generation, 35% come from manufacturing and 8% come from transport. (Almost half the electricity generated in China
is used for manufacturing. If emissions from that electricity are allocated to manufacturing, manufacturing’s share of total CO2 emissions jumps to 60%.) 25
This sectoral composition of emissions is very different than in most developed countries. In the United States, for example, roughly 25% of emissions of heat-trapping gases come from electric power, 27% from industry and 27% from transportation. 26
Coal combustion is by far the leading source of heat-trapping gas emissions in China, with roughly 7.6 Gt in 2021. 27
Figure 1-7: China’s CO2 Emissions by Fuel Type (1960–2020)
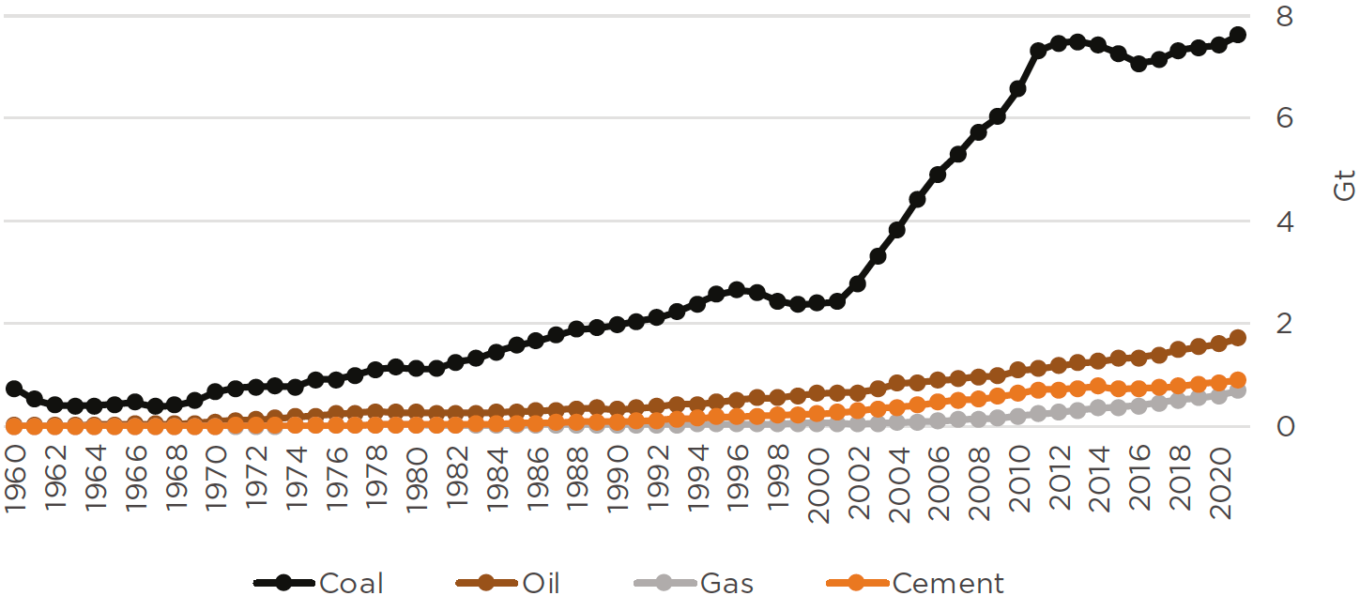
Source: The Global Carbon Project’s fossil CO2 emissions dataset 28
iv. Land Use Change and Forestry
Land use change and forestry in China are net sinks (meaning they absorb more CO2 than they release). Climate Watch, an online data platform managed by World Resources Institute, estimates that roughly 710 Mt CO2 were sequestered by land use change and forestry in China each year from 2011 to 2015 and 650 Mt CO2 were sequestered each year from 2016 to 2019. The most recent official estimates are from the Biennial Update Reports submitted by the Chinese government to the UN Framework Convention on Climate Change. The Chinese government estimates that land use change and forestry in China sequestered 576 Mt CO2 in 2012 and 1150 Mt CO2 in 2014. The reasons for the difference between the two figures are not clear. 29
References